Saturday, May 12, 2018

Kilauea 2018 eruption

UM News&Information

May 4
Hundreds of small and a few larger earthquakes have occurred in the past week—including a magnitude-5 on May 3—indicating that magma in the Kilauea volcano is on the move. Several surface fissures with magma fountains have already formed, and evacuation planning is under way for thousands of residents.

This type of eruption is less dangerous to human life than stratovolcanoes like Mount St. Helens and Mount Pinatubo, which are characterized by explosive volcanism and large ash clouds that reach into the stratosphere,” van der Pluijm said. “Hawaiian volcanoes are characterized by red-hot magma that bubbles and flows, and minor explosive activity. However, flowing hot lava destroys everything in its path. The Big Island is the most recent expression of millions of years of volcanism along the Hawaiian chain.

May 9
Kilauea has been continuously erupting for more than 35 years. Though this recent activity is a more active episode, it is not otherwise unusual. With about 100 acres covered by new lava flows, this latest Kilauea flare-up produced less than 1 cubic kilometer (about 0.2 cubic mile) of eruptive volume so far, which is a modest amount in the volcano's history. 

More than 1,000 shallow earthquakes reflect recent deep magma movement, fissures and subsurface displacements, including two larger quakes that rocked the area in the past week. These displacements have resulted in about 2 feet of seaward, southeast-directed movement of the volcano's south flank. Potential instability of Kilauea's south flank adds a Pacific tsunami hazard risk if land collapses into the sea.

May 17
Any danger is limited to the easternmost part of the Big Island. These types of eruptions are not that violent, except the potential of occasional steam-driven explosions that throw ash and rocks around in a small area. Better to keep some distance, and evacuate, regardless,” he said.

Fissure eruptions and slowly flowing lava are characteristic for the Big Island geology, with explosivity less common but recorded in prior eruptive events in the area as well. The origin of explosions is not the magma type, but heated water, somewhat analogous to a Yellowstone geyser.

Twitter (@vdpluijm)

May 1
Collapse of crater floor on #Kilauea Volcano’s East Rift Zone prompts increase in #seismic activity.  More lava coming? #Hawaii #volcano #geology

May 4

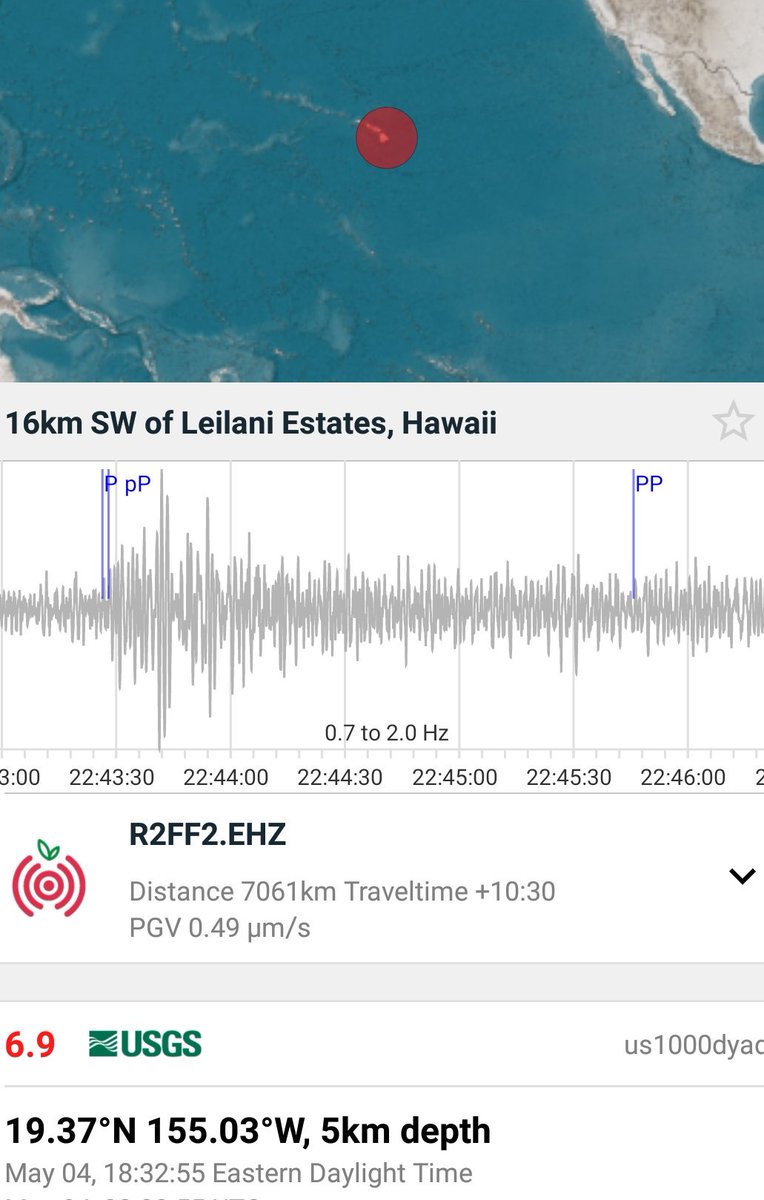
M6.9 was 7000 km away and my home shook 11 min later (well, my basement seismometer felt it). @raspishake #earthquake

May 9
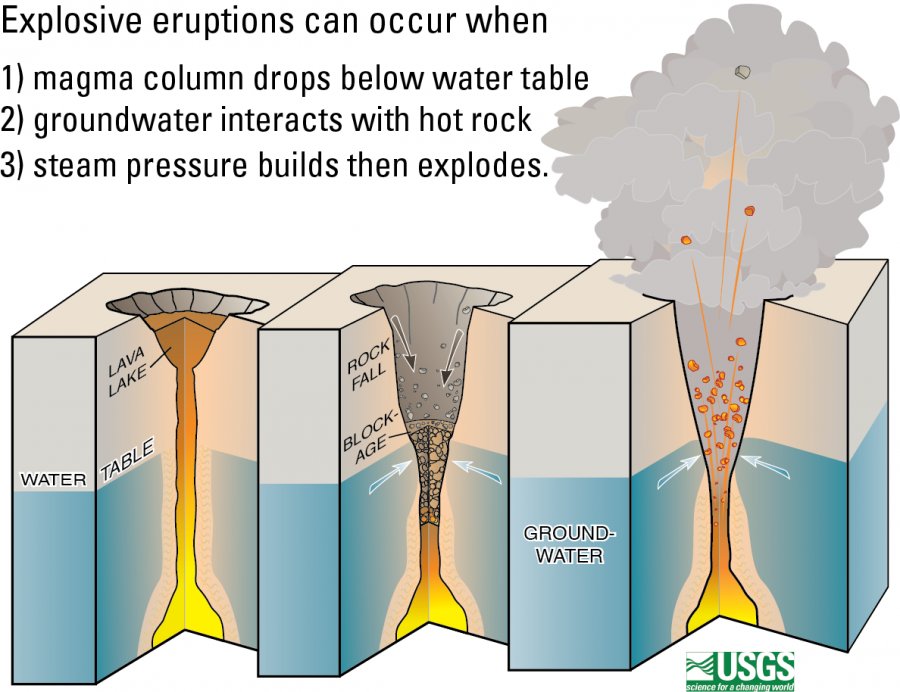
The other source of explosive volcanism, driven by magma submersion below groundwater table, not (silicic) composition of the magma.  Dangerous as well. 
This diagram shows how explosive eruptions occur at Kilauea: 1) lava column drops below the water table; 2) groundwater comes in contact with magma or hot rocks, 3) the flash boiling of water causes violent steam explosions.


May 12
Nicely illustrated summary of 2018 #Kilauea eruption event thus far, and its impact. More lava (and ash?) may be ahead.  #Resilience #geohazard  -- ‘Shell-Shocked’ in #Hawaii: How Lava Overran a Neighborhood


May 14
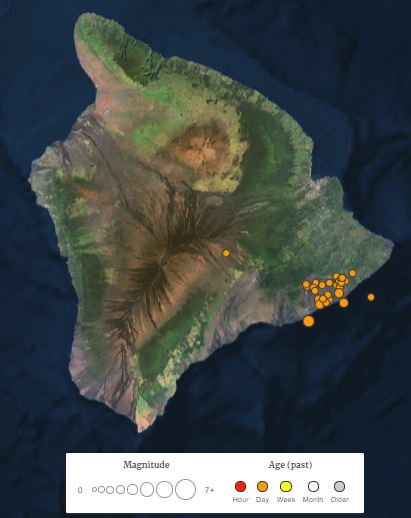
The Pacific Tsunami Warning Center created an animation of recent earthquake and volcano activity at Hawaii's Kīlauea Volcano, from April 21 to May 13, 2018. Thousands of small (<M3) and a few larger earthquakes, in addition to multiple fissure eruptions. Kilauea is not likely done, with more honey-like lava (effusive eruption) ahead and perhaps some steam-powered explosivity (phreatic eruption). #hawaii #geohazards -- youtu.be/bm9ezJQBOXs

May 17
May 14 Landsat image of Kilauea eruption region (+ some clouds).  Red marks active vents; recent flows gray; forest green; houses white.  Notice formally bubbling Pu’u ’O’o vent is now drained and a steady plume at Kilauea.

May 24
Lighter touch: The importance of Hawaii lava flows.
June 3
Whereas media coverage of #KilaueaEruption has waned, volcanism has not.  Several M5+ quakes and many smaller mark recent magmatic activity in crater region ("poolball").  

See @NOAA #earthquake animation through May 31: youtu.be/CybGAooIGZY. 

June 7&8
Just like significant tectonic plate boundary earthquakes have recurrence intervals (decades to centuries), so seemingly do volcanic earthquakes.  Kilauea's are 1-2 days leading to M5+. M5 is equivalent to ~500 ton #TNT explosion.
... June's fifth M5+ #earthquake in #Kilauea caldera, like clockwork.  Growing foreshock pattern is distinct from tectonic quakes that are characterized by aftershocks. Depth-magnitude-time plot (from VolcanoDiscovery):

June 11
Is Kilauea the new and bigger "Old Faithful"? Not exactly, but steady daily recurrence of M5+ earthquakes and venting continues.  Persistent absence of M4-5 quakes in caldera is a head scratcher (see plot), but may represent different processes in the volcano. 

July 6
Hawaii's "New Faithful" volcano continues with #earthquakes like clockwork.  On average just over 1 day (~1.2) between explosions in #Kilauea. Surprisingly consistent pressure cycling in its plumbing. 

July 21
Kilauea lava eruption and its future reported by USGS: 
- >430M m3 lava erupted so far is largest in centuries. 
- lava delta extends >800m from pre‐eruption Kapoho Bay coastline. 
- eruption may continue months to years.

https://volcanoes.usgs.gov/vsc/file_mngr/file-185/USGS%20Preliminary%20Analysis_LERZ%20July%2015%202018.pdf
Lava delta. une 18, 2018 (USGS)

August 8
Hawaii's Kilauea volcano hits pause button. Little lava flowing, no explosive earthquakes at caldera. At best, a geologic pause (=yrs, decades), but may also be only a human pause (=days, weeks). Activity will return, so stay alert, BigIslanders. 
Kīlauea's summit is quiet. August 2 (USGS)

August 14
Kilauea update. The geologic pause of lava flow and explosions continues, while coastlines redrawn (pic of new Pohoiki Bay). Flows not yet cold, but bill is, like the #BigIsland, growing: $680M. Cost of predictable #geohazards will be unsustainable.
Pohoiki Bay. August 12 (USGS)


Thursday, February 01, 2018

A Meteor in Michigan: Some Seismicity and Some Geometry

On January 16, a little after 8:08pm local time, a bright flash lighted the sky, and by some, even a bang was heard.  An object, a meteor, that earlier had entered our atmosphere became so heated by air friction that it exploded.  Some have reported surface recovery of small fragments of the object near the explosion.

Have a look at videos of the object and its explosion flash here: https://goo.gl/uwoqp1 (from MLive).

The explosion was recorded by several seismic stations in the region, with the AAM station of Ann Arbor showing a remarkably clean signal (below). The USGS calculated the magnitude as M2 based on groundshaking, but the source is very different from earthquake-generating fault motion in the solid Earth. Let’s use some basic geometry to learn a bit more about the event.


Observations place the flash about 30km north from the Ann Arbor-AAM seismic station.  The energy of the flash reached the AAM station at 8:10:15pm local time, meaning that ~100 seconds had passed since the reported 8:08:33pm time of the flash [best time estimate from posted videos].   This allows us to test whether the energy passed through the atmosphere or the solid Earth, or a combination.  Compressive (P) waves travel about 340m/sec in the lower atmosphere, while P ground waves travel ~5000m/sec in the rocks of Michigan.

Air waves
If the energy source is an explosion in air, than 100sec x 340m/sec gives a distance to the explosion of 34km.  With a horizontal distance of 30km, trigonometry gives an elevation for the explosion of ~16km above the surface.  The slow speed of the object indicates that it was already deep into our atmosphere, so this elevation seems reasonable.

Ground waves
If the energy is from impact of the object, then ~50km distance of the projected impact point to the AAM station at solid Earth wave speeds, means that the energy would have reached the station in ~10 seconds.  This short time neither matches the timing of events, nor observation of scattered meteorite pieces before the projected impact point.

Air and ground waves
If the energy was transferred by waves traveling from the surface location to the AAM station, the travel time would have been 30,000m ÷ 5000m/s, is 6 seconds.  Thus the soundwave in the atmosphere would have traveled ~95 seconds from explosion to surface, meaning an elevation of 95sec x 340m/sec, is 32 km.  Twice that of the sound waves through air only scenario above, and a little high.

Looking at the lower WNW trajectory of the meteor, the angle was estimated at 30o from the projected surface intersection of its path, which is about 30 km from the explosion.  Using trigonometry, this means that the explosion occurred at an elevation of ~17km.  This estimate matches the first, air-only calculation of elevation very well, but not the calculation involving solid Earth groundwaves.

We learn from the Ann Arbor seismic record and reported timing of events that regional shaking associated with the exploding MI meteor is from the pressure of sound waves passing through air.  This pressure was enough to shake buildings and be heard locally, and move the ground surface over several 10s of km.  The exploding object did not significantly pass groundwaves through solid Earth, nor was physical impact of the object a source of energy.  Given the USGS M2 equivalence of groundshaking, we also can try to estimate the surface expression of the explosion at ~16km elevation.  Whereas an M2 earthquake is equivalent to exploding several tens of kg of TNT in solid material, a real calculation of the explosive power at elevation in the atmosphere is beyond my abilities.

So, a seismic station, citizen observations and basic trigonometry illuminate some details of a January 16 exploding meteor over Michigan that mesmerized local scientists and the public alike.

Thanks to my office colleagues Eric Hetland, Yihe Huang and Jeroen Ritsema for fun conversations.

Follow Ben van der Pluijm on Twitter: @vdpluijm

Tuesday, January 23, 2018

Weather or Not

"Weather is your mood, climate is your personality." (Marshall Shepherd)

We just learned that the year 2017 is the 3rd warmest year since modern recordkeeping of global temperatures.  It is not a “winner” year, so not really considered newsworthy after 2016’s record breaking.  However, 2017’s bronze medal finish masks the important observation that the four warmest years so far have all occurred in the decade that started in 2010 (see figure).  The decade before, 2000-2009 is the current record holder, which will undoubtedly be eclipsed by 2010-2019.  Such decadal trends are much better indicators of climate change than yearly or seasonal records  and, especially, weather.  


Annual temperature anomalies through 2017 relative to 20th Century temperatures. 
Credit: NOAA, https://goo.gl/vfMe8o

Cataloguing 2017 as the 3rd warmest year for the US seems to contrast with personal weather experiences.  Since December the US northeast has been battling bitter winter conditions, with very low temperatures and considerable snowfall.  Where is the warming, as President Trump tweeted at the end of the year?  Weather is the expression of short term, local condition of the atmosphere, or the “here-and-now”.  While weather is ultimately linked to climate, it only does so over long time period, not the current conditions, or the “now”.  Also, weather patterns are local, so one person’s cold snap experience is matched by another’s unusual heat, the “here” of weather. 

Confusing weather and climate also arose during 2017’s late summer hurricanes that battered the southern US and the Caribbean (notably Harvey, Irma and Maria).  Researchers, media and tastemakers alike were eager to blame global warming for the unusual and costly occurrence of several major storms in 2017.  But the evidence is again more complicated, as we also have had low storm cycles in recent, otherwise warm years.  Maybe next year we have another lull in storm activity, which no more characterizes climate warming, as high storm activity in 2017.  We know that, as the atmosphere and the ocean warm, more energy is available for the build-up of major storms.  But warming is a gradual and slow process.  Only as the 21st Century progresses do we expect to see more and/or stronger storms, but sequential years have little change on average.  A year without major storms, just like a cold period, is no more evidence for climate stabilization or cooling, than a year with great storm activity is evidence for climate warming.  This eagerness to conflate weather with climate in support of one’s favored argument feeds today’s contentious discussion, while clouding the urgency to address the impacts of a changing climate on regional and global scales.

Whether 2017 is a cooler year than 2016 and 2015, whether it is characterized by a cold spell, or by major storm activity must not affect the need to address the slow atmospheric, ocean and land warming that is taking place around the world.  The impacts of warming will be significant, if not calamitous for the unprepared, especially the less-developed equatorial nations and the poor of the world.  Reductions in greenhouse gas (GHG) emissions, as proposed by the 2016 Paris Accord, provide an admirable step in the right direction, but is not enough to stop or even slow gradual warming.  To achieve that, more aggressive emission reductions are needed, as a recent UN report showed (the 2017 Emissions Gap Report, https://goo.gl/JXHMv3), or through climate intervention.  The latter, more ominously called geo-engineering, aims to address the symptoms and roots of warming through solar radiation management of GHG removal, respectively.  Given that human society has been engineering climate through GHG addition since the mid-19th Century industrial revolution, perhaps climate retro-engineering is a more appropriate descriptor.  While weather is good watercooler conversation, it is not a good proxy for the climate change debate.  Whether or not the bronze medal for 2017 warming will become a gold medal for 2018, warming is underway, and we should aggressively deal with it, better sooner than later.

[Follow Ben van der Pluijm on Twitter: @vdpluijm]

Wednesday, October 11, 2017

Shining a Light on Roof Solar Panels

Unless individuals make a move, energy alternatives will remain a bit player in addressing the challenges from fossil fuel emissions.  So, we decided to take the leap of roof solar panel installation for our home in Michigan.

Want to see how we're doing: https://monitoringpublic.solaredge.com/solaredge-web/p/kiosk?guid=2a13f778-d7ec-43cf-b834-b7a400ae7776 ?

Step 1.  Plans and Contract

Research into solar powering our house started with an online search, followed by an expensive, out-of-state bid in 2016 and a more moderate bid from a Michigan company in early 2017.  Some email exchanges and then a formal proposal that was based on Google Earth imagery of our home (picture below; North is up).  No home visit occurred until later.


The bid is based on one year of electricity use, which, in our case, includes an outdoor hot tub (winter), A/C (summer), electric cooking and baking, but not requiring electric heating of water and air (besides well pump and furnace fan).  The calculation includes efficiency from SSE roof orientation and sun days, resulting in the installation of 30 panels that each can deliver 295W peak.  The total production represent ~100% of our electricity use on a full year basis.  Obviously, more electricity is generated in Summer when the Sun shines for more hours than in Michigan's Winter, while electricity use is inversely proportional to the seasons. Winter days are also affected by sun angle, which is much lower than summer, further limiting unimpeded panel illumination. 
The year calculation is below.


Our local energy company (DTE) only offers an energy credit structure for consumer electricity generation.  This is a key piece to consider before going this route.  Will the company offer energy credit as kWh during summer excess generation for winter use?  Does the company pay for excess energy?  The latter sounds good, but remember that they'll offer less per unit than they charge, and that they may require a long term lock-in rate that does not increase.  The latter is simply a bad deal.

On our area, DTE is an energy credit company, which guides the decision to install panels with power generation that about match our yearly usage.  In fact, the power company approves the maximum installation with this requirement.  Disappointingly, no incentives, credits or benefits are offered by town or state.  Luckily, a federal credit is available, which covers a substantial 30% of the full costs of installation.  Two nice gentlemen from Michigan Solar Solutions (http://www.michigansolarsolutions.com/) visited the house for roof and electrical panel inspection, and, after signing some paperwork, left with the down payment that started the process.

Step 2.  Approvals

It took 4 weeks to get approvals in place before installation.  Power company (Detroit Edison), city and township, even the county got involved.  Never seen that many interested parties and rules.  The power company was swift and supporting.  The civic approvals seem to focus on footprint and engineering specs.  The latter reflect the ability of the roof to carry the added load of solar panels, which should be ok for a typical home, and aesthetics.  A final building inspection took another week after panel installation, followed by the energy company's changeover another 2 weeks later.  Quite a few folks visited along the way.

Step 3.  Installation

Electricians and roof installers arrived around 8am and panels were delivered shortly thereafter.  The installation requires two vacant breakers on the breaker panel to connect with a controller unit outside.  This controller, in turn, connects with an inverter on each panel, requiring the installation of a thick wire tube outside the house.  That took about 3-4 hours.  Meanwhile roof workers installed racks to hold the 30 panels.  The panels are connected serial-like, allowing for replacement and additional panels.  A final outdoor switch was installed that cuts the system from the power company meter, as required, and shuts down the panels.  By 5 pm all panels and boxes were installed and running.  Drone camera images are below (courtesy of Jamal Hassunizadeh).


Running does not mean ready for use, however, as electrical and building inspections, and power meter changes are still needed.  The first two took another week and the meter change another 2 weeks.  Meanwhile precious late summer photons remained unused.  The inspections went smoothly.  Lastly the power company guy appeared on Friday afternoon at 5pm (after a couple of phone calls) to reprogram their meter to bi-directional metering.  Then the switch was permanently thrown.

Step 4. On

Remote power monitoring offers addictive opportunity for owners.  Weather has an entirely new dimension and clouds are cursed.  It is clear why they are called solar panels, and not light panels. The gentleman from Michigan Solar Solutions returned for their final payment a couple of days after the system went live.

Power and Energy

Energy is the ability to do work.  The unit is Watt-hour, meaning one Watt of electrical power, maintained for one hour: 1 Wh of energy.  Power means how fast the energy can be used, so it is energy over time; the unit is, thus, Watt.  A 30W lightbulb describes power, while energy consumed is a function of the time one uses that power.  Running a 30W bulb for 2 hours means 30*2=60Wh.  Have a look at this site for more explanation: https://cleantechnica.com/2015/02/02/power-vs-energy-explanation/

Today, our system of 30 panels is, for example, producing 5.5 kW, with an installed max of (30*295=) 8.85kW. In one day, it produces, say 30 kWh, which well exceeds our average use, but not by much. On a dreary and foggy day, the panels are producing a few hundred W only.  As the fog dissolves, this quickly moved into kW, peaking in the middle of the day when the sun is at its maximum.  Below is an annotated example record from the last 2 weeks of September.  Power generation should vary by season, peaking in late spring and summer.


A few surprises

Living in an area with frequent power outages, the panels will not supply energy to the home when the electricity grid is down.  This has to do, I was told, with frequency variations from consumer-grade generators and converter panel electronics that require active lines outside the house.  Glad we kept the generator for more than just nightime outages.  When, in the future, reasonably-priced batteries become available, the panels will be able to power the house without grid connection, after additional rewiring of charged batteries.  Note to Elon Musk: hurry up.

Installation of panels and electrical wiring took a day, but approvals and inspections drag on.  It took >8 weeks from signing the contract to operating the system.  The key step, energy company switch to solar metering, took another 2 weeks after all installation and inspections were done.  These permissions and visit scheduling alone are reasons to use a licensed contractor instead of managing installation oneself.

After a week the system went down (see image above).  A visit by the installer the next morning (quick response!) confirmed my suspicion that the problem was the home breaker box.  Ironically, the only part not new was the culprit, and an easy fix.

What about cost?

I am not sharing the actual cost of our installation, as this varies by size and region (and is nobody's business), but, based on our yearly electricity use and kW/h rate of DTE, we should see a positive return on investment after 10-12 years.  Clearly, this is not an investment strategy, but a moral choice.  The investment return calculation does not include price increases in electricity delivery (shorter return years), nor income loss from interest/investment of the money, or non-warranty repairs (longer return years).  Warranty should cover any malfunction for 6-10 years (depending on item), except for natural events like falling branches/trees, wind and hail, which are under the home insurance (with deductible).  We removed one set of branches that were overhanging, limiting two end panels' production.

The turnkey price of installation comes with a 30% federal rebate that is processed with that year's federal taxes (or prorated).  In shameless Michigan, no other incentives are offered, not even tax-exempt parts and installation.  A haircut has no taxes, but renewable energy does.

Stay tuned for a cost efficiency update in a few months, power production and any hiccups along the way.

[Follow Ben van der Pluijm on Twitter: @vdpluijm]